
Dashboard & reports
Live KPIs on the dashboard and sales analytics in Reports.
Dashboard
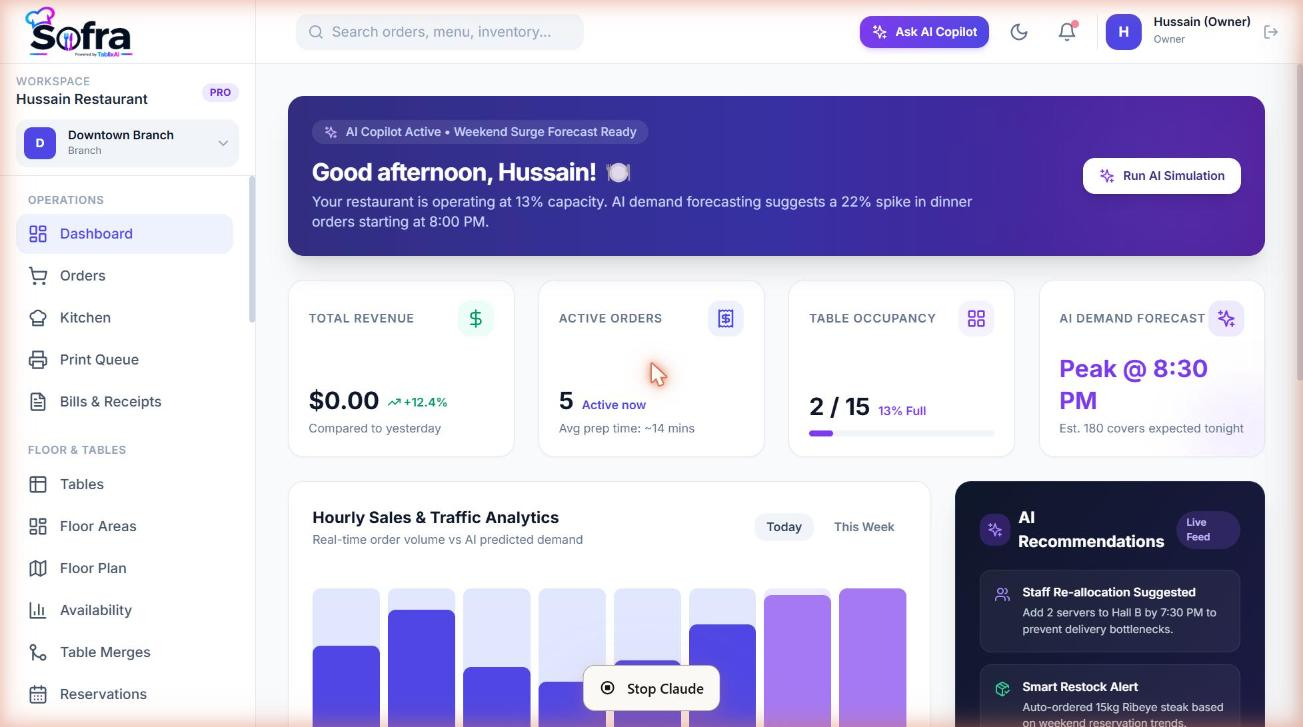
The Dashboard is the first page after you sign in. It greets you and shows live figures for the selected branch:
- Today’s revenue and the number of active orders.
- Occupied tables out of the total.
- Recent live orders with status.
- Inventory alert: ingredients at or below their reorder level.
Reports
Go to Management → Reports. Choose a range of 7, 30 or 90 days. Reports use completed and paid orders.
| Report | What it shows |
|---|---|
| Sales summary | Total revenue, total orders and average order value, plus revenue and order count per day. |
| Top items | The ten best-selling items by quantity, with revenue. |
| Branch comparison | Revenue, orders and average order value per branch, side by side (head office view across all branches). |
Reports follow the branch you have selected; without a branch they cover the whole restaurant.
Usage report in the portal
Owners also get a Usage tab per restaurant in the portal: consumption against plan limits, orders and revenue for the last 30 days and a daily chart. See Account & owner portal.
Ready to try it?
Create a free account and follow along.